Rail corridors generate a large amount of visual information: trackside conditions, structures, crossings, signals, access points, vegetation, utilities and maintenance activity. Railroad 360 video can capture that context continuously so teams can review a corridor from the office instead of relying on disconnected folders of photos.
OcuMap does not replace engineering surveys, track geometry systems or authoritative asset databases. It provides a visual documentation layer that keeps field imagery, point clouds, drawings and project records connected to the locations they describe.
What railroad 360 video is useful for
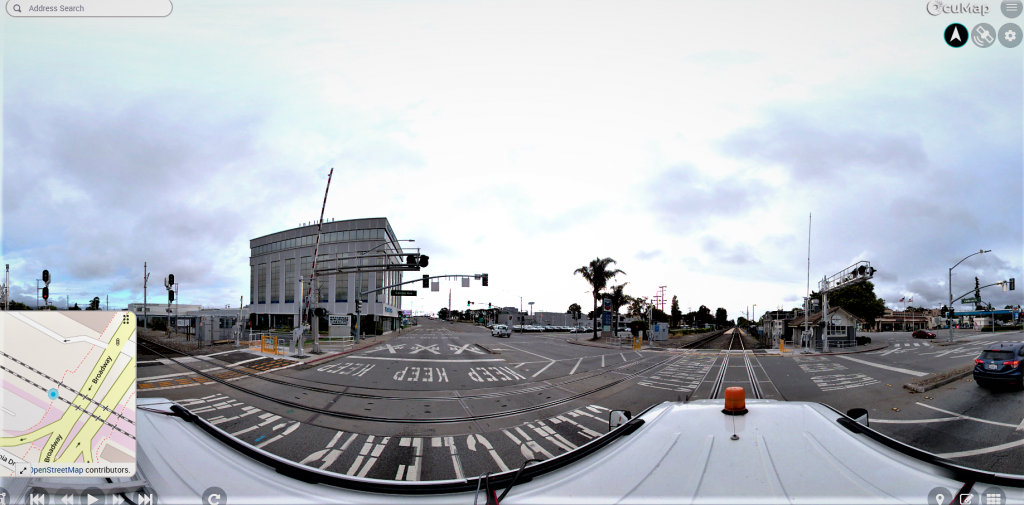
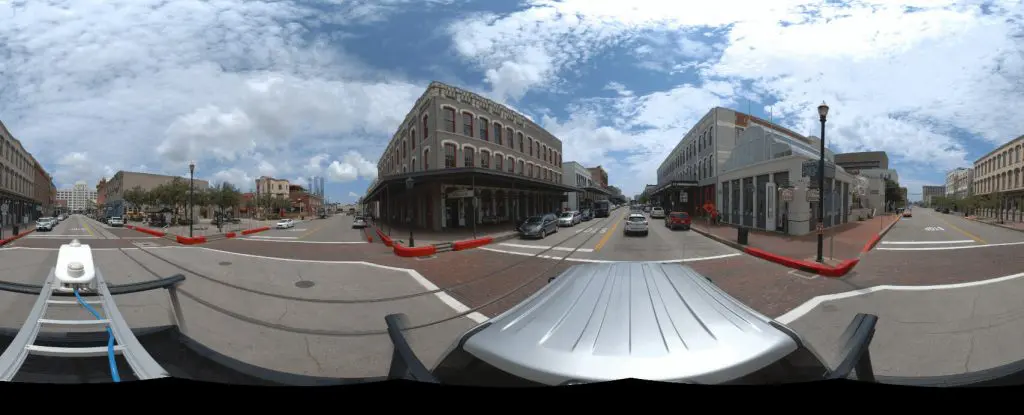
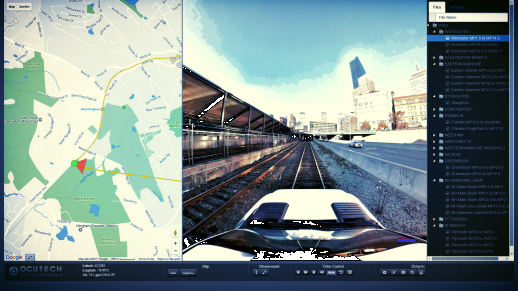
A 360 camera mounted on a hi-rail vehicle, inspection vehicle or other approved platform can record the right-of-way in all directions while moving through the corridor. GPS information from the capture system can then be used to place the imagery on a map.
- Reviewing visible trackside conditions and access constraints
- Documenting crossings, structures, signals and above-ground assets
- Giving design, maintenance and construction teams shared visual context
- Creating a baseline before construction or maintenance work
- Returning to the same location later to compare visible changes
Bring the corridor into OcuMap
OcuMap is hardware agnostic. Teams can use the cameras and capture workflows that fit their project, then upload the resulting documentation. GPS-based photos and video can be organized on the map, while point clouds, PDFs, CAD/BIM references and other project files can stay connected within the same project.
For rail work, this matters because the useful record rarely consists of one media type. A corridor may include panoramic imagery, standard photos, video, LAS/LAZ/E57 point clouds, drawings and supporting documents. OcuMap keeps those records together instead of forcing each format into a separate application.
Measure and compare conditions
When a supported photo can be calibrated, OcuMap can be used to measure lengths and areas directly in the image. Native point-cloud measurement is also available for LAS, LAZ and E57 data. These tools are useful for remote review, but they do not turn ordinary imagery into survey-grade control.
Historical comparison is especially useful for recurring corridor documentation. Imagery from the same location can be compared side by side across different dates to understand visible changes in vegetation, access, structures or maintenance conditions.
Share the record without exposing the workspace
When the documentation is ready for others, a Published Viewer can present selected project information in a read-only browser experience. Contractors, owners and stakeholders can review what has been published without receiving access to the internal workspace or needing specialized desktop software.
Where OcuMap fits
OcuMap is best used as the visual documentation and delivery layer around the rail project. Survey control, track geometry, GIS and engineering systems remain authoritative for the data they own. OcuMap helps make the supporting visual evidence easier to find, understand, compare, measure and preserve.
Explore rail documentation with OcuMap →
Practical checklist
- Define the route, site or asset context before collection.
- Choose capture equipment based on the accuracy and visual detail required.
- Preserve source location and date metadata.
- Keep authoritative GIS, survey or utility-locating data separate from visual observations.
- Plan repeat capture if change over time matters.
- Publish only the documentation appropriate for outside stakeholders.
Related resources
Common questions
Does OcuMap replace a railroad survey?
No. OcuMap organizes and presents visual documentation. Survey control, track geometry and engineering measurements should come from systems and methods designed for those purposes.
Can rail imagery be compared over time?
Yes. Documentation from the same location can be compared side by side across capture dates to review visible change.
Can point clouds be included?
Yes. LAS, LAZ and E57 point clouds can be viewed and measured natively alongside imagery and other project records.