An easy way to transform and publish your csv to a map
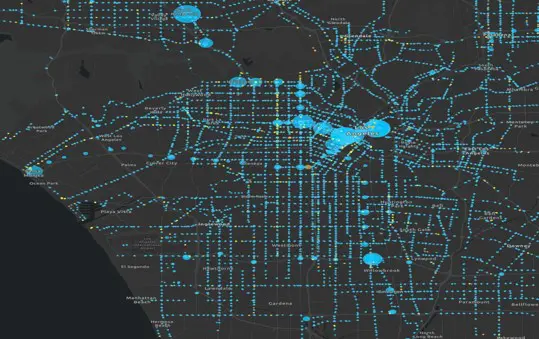
Converting your data tables from CSV to interactive maps has never been easier

Create a Project Folder

Drag and Drop your data to upload it

Verify and publish
Try it by yourself!

Build interactive maps that explain your data
Transform your big data Into a map and see it from a new perspective
-
Zoom in on what matters to you, gain more details
-
Visualize your CSV data and explore new insights
-
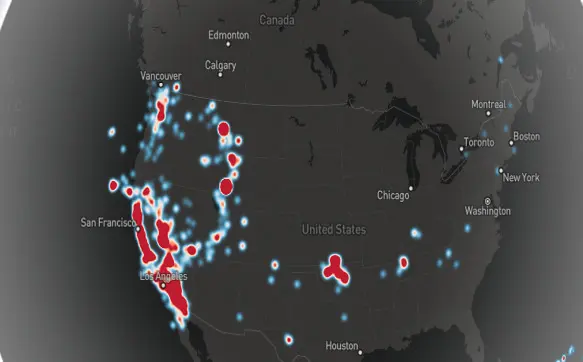
Use heatmaps to visualize location footprint
Group your data and visualize locations by patterns
Mark locations on the map, color code your data and publish for immediate analysis
-
Gain valuable insights by looking at the map
-
Visualize and share your map with your team and clients
-
User-friendly mapping tool built for everyone


Utilize existing data to boost insights
OcuMap helps you maximize your business potential through Visual mapping
-
Map your real-estate properties and investments
-
Map your sales territories and understand densities
-
Get the insight you need to boost your productivity
Try it by yourself!
The highest possible security to keep your data safe
-
Data is encrypted using 256-bit Advanced Encryption Standard (AES)
-
OcuMap uses Secure Sockets Layer (SSL)/Transport Layer Security (TLS) to protect data in transit between web application and our servers
-
Authentication system protects against unauthorized access to keep your data secure
-
SOC 1/ISAE 3402, SOC 2, SOC 3
-
FISMA, DIACAP, and FedRAMP
-
ISO 9001, ISO 27001, ISO 27017, ISO 27018

Frequently Asked Questions
Assuming you have GPS coordinates in your CSV file, you can simply drag and drop it in OcuMap to see the location for all your data points on the map
The recommend number of unique data points in a single CSV file should not exceed 10,000 points. This will ensure maximum performance when working with the map
once you upload the CSV file, the data points will be displayed as dots on the map, each dot will have a Lat/Long associated with it. To see the lat/long of each data point, you can simply click on the dot on the map.
Create an OcuMap Account
Start visually mapping your data now with a 14-day free trial.
“The video map provided us with intelligent visual information to be used as a reference for planning, and as a baseline for comparison with future assessments.”

The City of Houston
Rod P. Deputy Director
Contact us
"*" indicates required fields

